
About this template
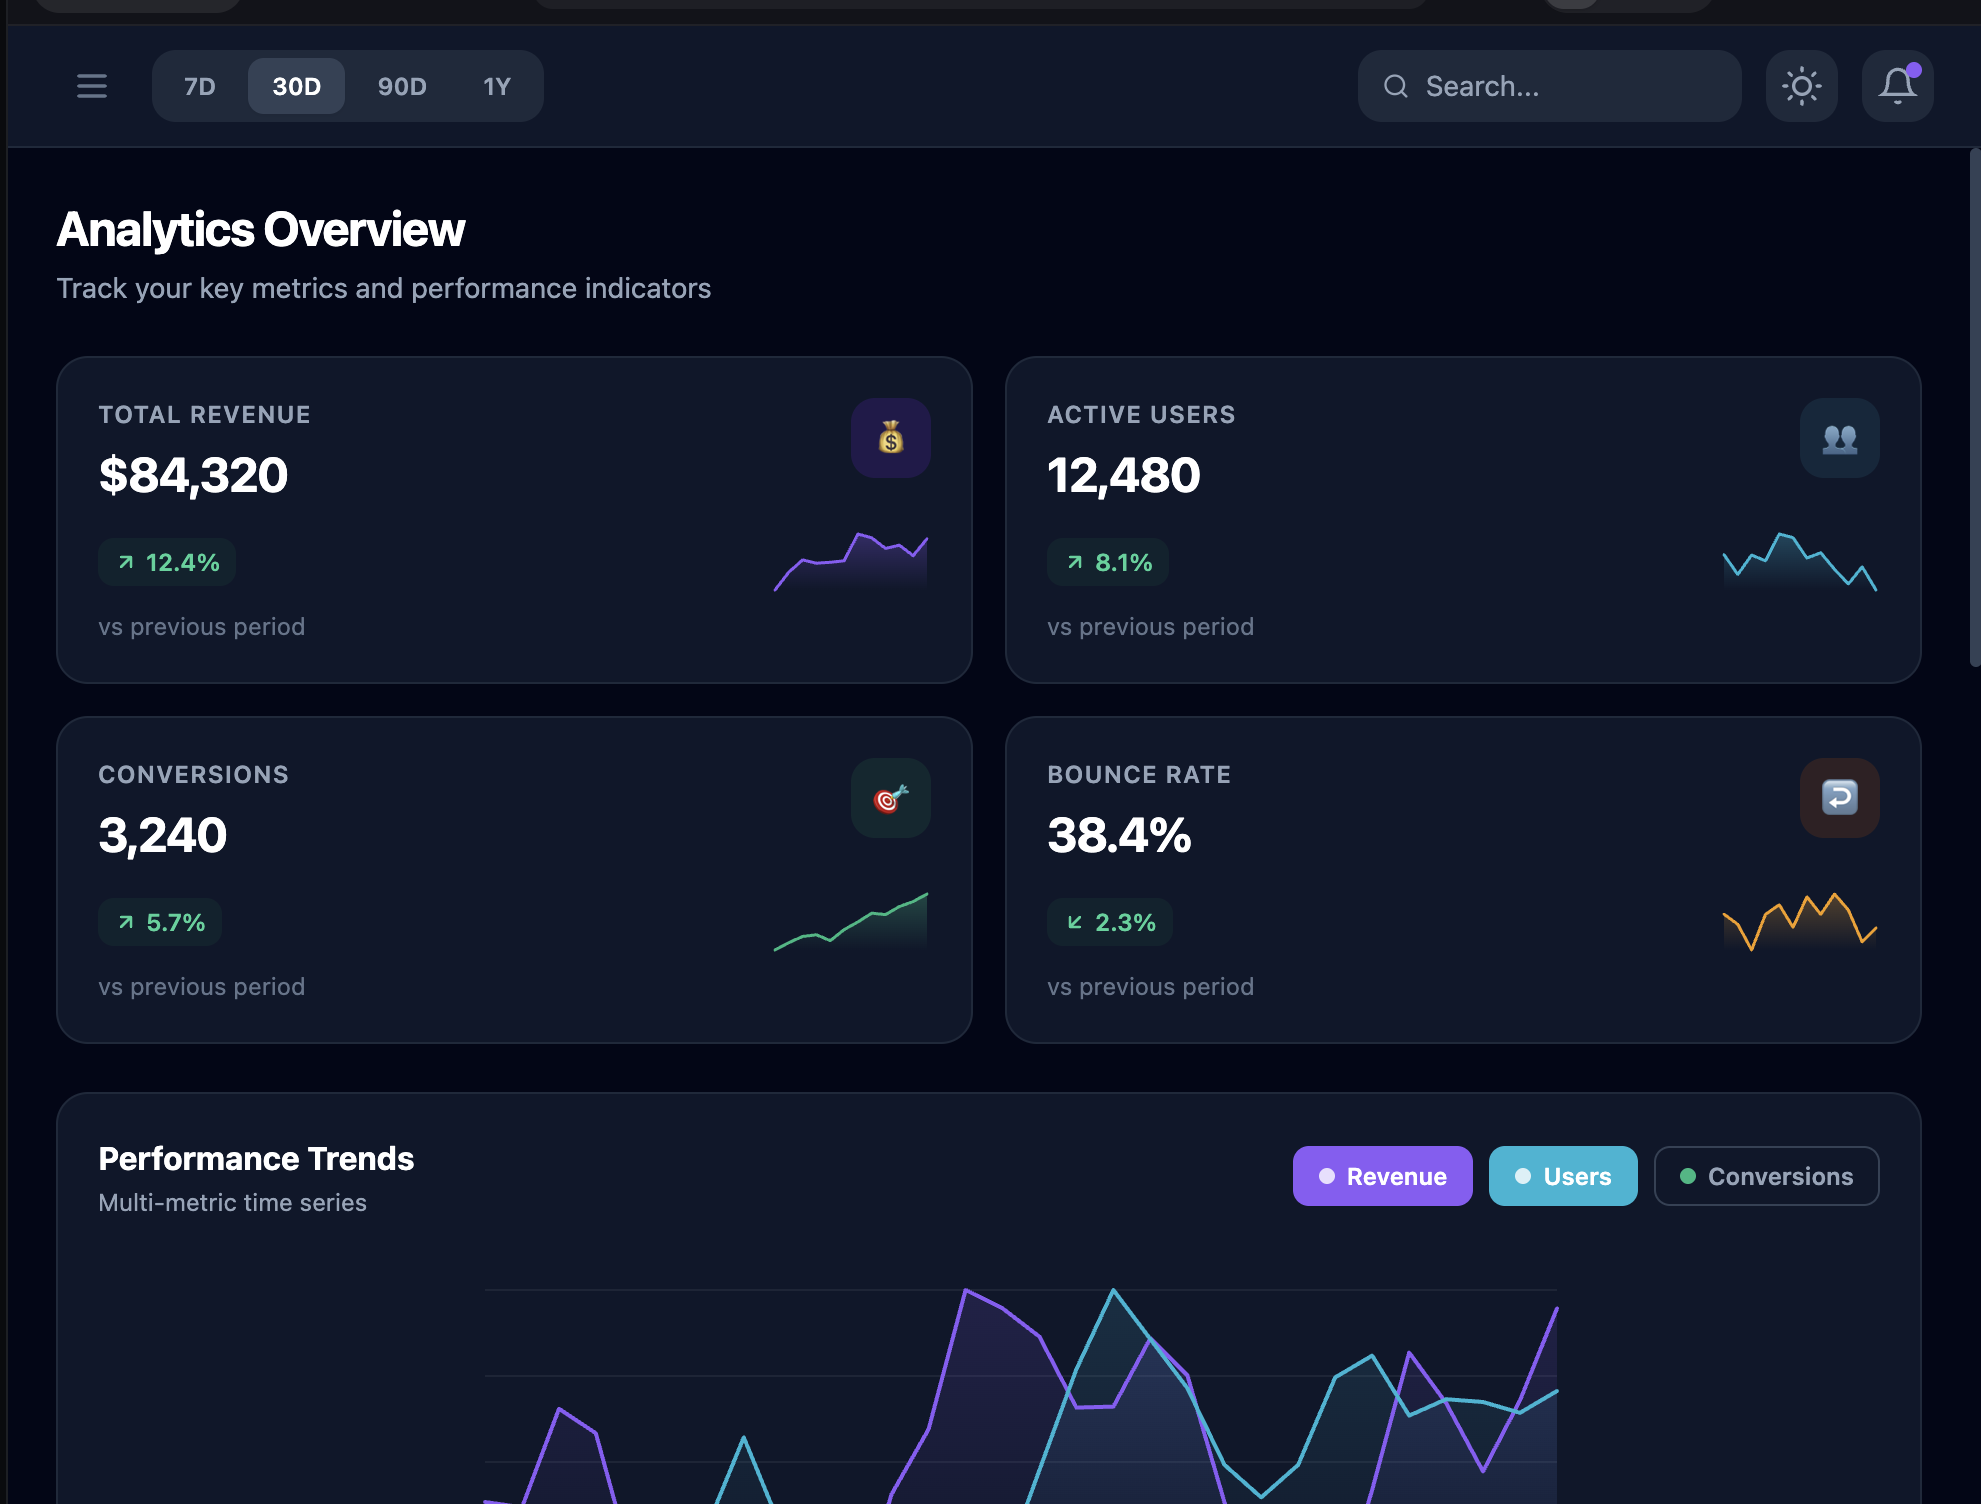
This template gives you a full analytics dashboard with a fixed left sidebar containing 6 navigation items, a sticky top bar with search and export, and 4 KPI summary cards showing revenue, active users, new orders, and bounce rate — each with trend indicators. The main area features a 12-month revenue bar chart with period toggles (7D, 30D, 90D, 1Y) and a top products section with progress bars. A 6-row orders table displays status badges (Completed, Processing, Shipped, Refunded), amounts, and dates. Dedicated customers and settings pages round out the experience.
Your data, your way. Customize the KPIs to track what matters most to you, add new chart types, rearrange the sidebar navigation — just tell Panda what metrics drive your business and it will reshape the entire dashboard to fit your vision.
Analytics Dashboard
KPI cards, charts, and data tables.
Used by 6 creators
Key Highlights
KPI Summary Cards
4 metric cards showing revenue, active users, new orders, and bounce rate with trend indicators.
Revenue Bar Chart
12-month revenue chart with period toggles (7D, 30D, 90D, 1Y) and responsive bar styling.
Orders Table
6-row data table with status badges (Completed, Processing, Shipped, Refunded), amounts, and dates.
Customers & Settings
Customer list with search filters and dashboard settings page.